Overview
AI cost management only works when spend is tied to the value it produces. Raw model spend is not the number that matters. The real questions are whether the organization understands its cost per outcome, owns that cost, and keeps improving the economics without quietly degrading quality.
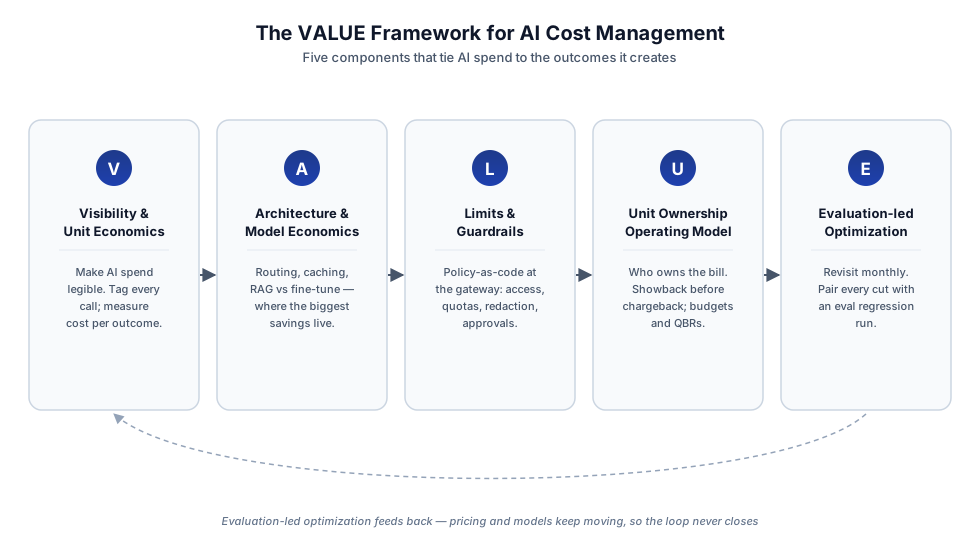
VALUE in sequence: visibility funds the limits, ownership makes them stick, and evaluation-led optimization feeds back as pricing and models keep moving.
AI cost management is not an add-on to IT cost management. It is its own FinOps discipline, and it only holds together when every dollar of spend is tied to the value it creates.
The framework is five components, sequenced deliberately. You cannot govern what you cannot see, and you cannot optimize what you do not own:
- V - Visibility and Unit Economics
- A - Architecture and Model Economics
- L - Limits and Guardrails
- U - Unit Ownership Operating Model
- E - Evaluation-led Optimization
TL;DR
Generative AI breaks the assumptions cloud FinOps was built on: the same outcome can cost $0.001 or $0.30, a few extra paragraphs in a system prompt can inflate the bill across millions of calls, and the price list moves every quarter. Managing it needs its own discipline. VALUE sequences that discipline into five components: see the spend, engineer the architecture, set the limits, put a name on the bill, and optimize against evaluations. Cost stays tied to outcomes instead of becoming a credibility problem with the business.
The bill always comes due. The framework decides whether you saw it coming.
Why it needs its own discipline
Cloud FinOps was built on predictable cost drivers: compute hours, storage, licenses, and data transfer. You could forecast a workload’s bill within a sensible range. Generative AI breaks most of those assumptions. The same feature can change cost based on token volume, prompt design, model routing, reasoning depth, retrieval strategy, retries, and tool calls.
A single product feature can swing 10x in cost between a quiet Tuesday and a viral launch day. Token-based pricing means a small change to a system prompt can quietly inflate costs across millions of calls. The same business outcome can cost $0.001 or $0.30 depending on whether you routed to a smaller model with good retrieval or to a capable model with the entire knowledge base stuffed into the context window. Unlike compute infrastructure, the price list itself moves. The model you standardized on last quarter is probably cheaper today, deprecated, or has a smarter sibling. Layer decentralized adoption on top, business units standing up their own AI use outside central oversight, and the same volatility shows up as shadow spend and shadow risk, not just a wide range on a forecast.
The goal is not to cut AI spend by default. The goal is to scale high-value work, reduce waste, and stop funding work that cannot show value.
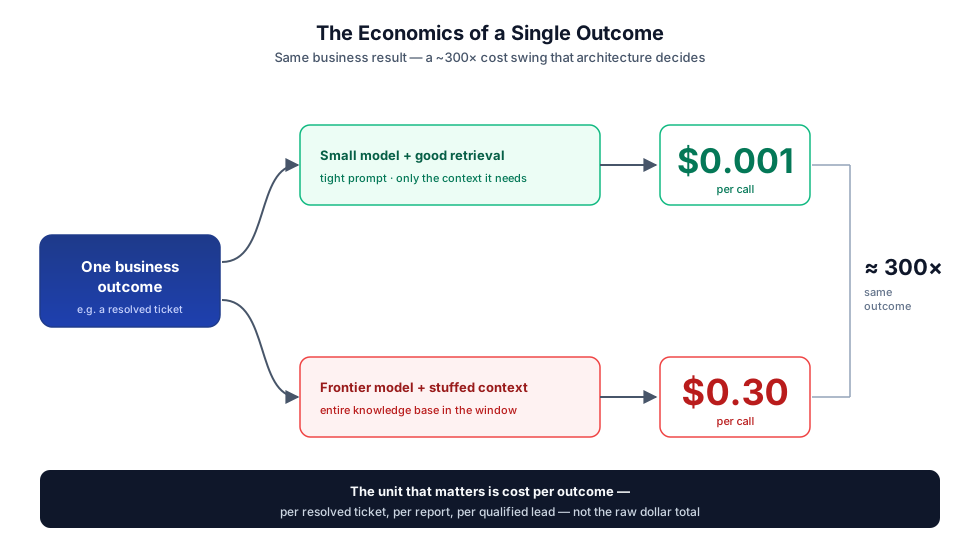
The same outcome, ~300x apart. This is why the unit of analysis has to be cost per outcome, not raw spend.
Add executive expectations that “AI should pay for itself by next quarter” on top of unit economics that move this much, this fast, and the pieces compound. Without an explicit discipline, what you end up with is not a cost problem. It’s a credibility problem with the business.
The VALUE components
The five components are ordered on purpose, but the order is a guide, not a strict gate. Each one makes the next easier: visibility makes limits enforceable, limits without ownership are theater, and optimization is only safe once evaluation proves you haven’t traded quality for savings. A small program can start with the components it needs most and add the rest as it scales.
V · Visibility and Unit Economics
The first job is to make AI spend legible. Every call, workflow, and outcome should carry enough context to explain who used it, why it ran, what it cost, and what value it produced. Tag by business unit, product, feature, environment, user cohort, data classification, model, provider, and outcome ID. Capture token counts, latency, prompt size, completion size, cache status, retries, and error states, even if the telemetry layer starts scrappy.
Raw dollars are not the unit of analysis. Cost per resolved ticket, generated report, or qualified lead is. Until the organization can express AI spend in business terms, every conversation defaults to “is this too expensive?” which has no defensible answer.
Cost is only half the ratio. Tag the value each outcome creates: the revenue it books, the hours it saves, the ticket it deflects. Report value per outcome, not just cost per outcome. A cost number tells you what to cut. A value number tells you what to scale. The name of the framework is the point: spend earns its keep only when you can show what it bought.
A · Architecture and Model Economics
This is where the largest savings live, and where most programs underinvest. A few patterns carry most of the savings:
- Model routing. Not every call needs the most capable frontier model. A tiered approach (start with a smaller model, escalate on confidence or complexity) routinely cuts costs 40–70% without measurable quality loss when paired with good evaluation.
- Caching, at two levels. A surprising share of production traffic is near-duplicate. A semantic cache that recognizes paraphrased queries can absorb 20–30% of calls. Underneath it, prompt caching at the provider level discounts the repeated prefix (the system prompt and retrieved context sent on every call) by up to 90%. The two stack well.
- Retrieval over context stuffing. Send only the context the model needs. Retrieval-augmented generation (RAG) with a good retriever is usually cheaper to operate and easier to govern than fine-tuning. Fine-tuning works well for stable, narrow, high-volume tasks where the savings clearly pay back the operational overhead. When the underlying knowledge changes weekly, fine-tuning is usually the wrong answer.
- Batch over real-time where latency allows. Asynchronous batch processing runs at roughly half the price of synchronous calls. Reporting, back-office classification, and overnight enrichment do not need a sub-second response, so they have no reason to pay the premium for one.
- Prompt hygiene. Remove unused instructions, stale context, and padding. A prompt-hygiene review almost always finds 15–25% savings in the first pass.
Two newer dynamics reshape the bill before any lever applies. Reasoning models charge for thinking tokens you never see. A model with a low sticker price can cost more per answer than a pricier one that thinks less. Judge on cost per outcome, not the rate per token. Agentic workflows turn one outcome into a chain of calls. A single “resolve this ticket” can fan out into a dozen tool-calling turns. Budget and measure at the level of the outcome: that is where the tokens land.
Build-vs-buy decisions belong here too. Self-hosting an open-weight model only beats an API call once your sustained throughput crosses a real break-even. That calculation must include hardware availability, MLOps headcount, evaluation tooling, and the opportunity cost of slower iteration. I’ve seen organizations spend a year building infrastructure to save money they would have saved faster by changing a prompt and switching to a cheaper model.
L · Limits and Guardrails
Visibility and architecture choices only stick if the organization has rules of the road. This component covers model access policies (who can call what, from where, and at what risk level), approval workflows for new use cases above a cost threshold, prompt and output guardrails, data residency, and quota enforcement. Implement it as policy-as-code wherever possible, enforced at the access layer rather than relying on goodwill. A central AI access layer is one of the highest-ROI investments a program can make: it gives you a single chokepoint for routing, logging, rate-limiting, redaction, and cost attribution. Without one, every team reinvents these controls badly.
U · Unit Ownership Operating Model
Tagging without ownership is theater. This component establishes who owns the bill. Start every program with showback before chargeback: give teams a clean monthly view of their AI consumption, with unit economics attached, for at least one quarter before any money moves. Chargeback prematurely and you punish the teams who instrumented properly while the laggards hide. Establish budgets per product or business unit with automated alerts at sensible thresholds, a forecasting cadence the FP&A team trusts, and a quarterly business review where AI spend is discussed in the same forum as revenue and gross margin. Make sure procurement is in the room. Model vendor negotiations are now strategic, not transactional.
E · Evaluation-led Optimization
Pricing moves. Models evolve. What was optimal last quarter often isn’t today. Build a standing cadence (monthly works well) to revisit model selection, prompt efficiency, cache hit rates, and routing thresholds. Define the quality bar for each use case before you start optimizing. Pair every cost optimization with an evaluation regression run. The worst outcome is saving 30% on inference while quietly degrading the user experience. Monitor user impact after release. Treat evaluation as a first-class part of the cost program, not a model-team-only concern. This is the component that closes the loop and feeds back into the other four.
The foundation layer
VALUE works best when it rests on shared infrastructure. This foundation does not require a single provider. It requires common capabilities that can be built, bought, or assembled from existing tools. Without it, each team re-solves the same problems in isolation and the framework never scales past the first workload.
| Foundation capability | What it provides |
|---|---|
| AI access layer | A common path for approved AI use: gateway, proxy, platform service, or broker. |
| Telemetry layer | Logs usage, model choice, token volume, latency, errors, retries, cache status, and outcome IDs. |
| Data governance | Classifies data, controls sensitive content, and defines retention and access rules. |
| Evaluation system | Stores test sets, quality metrics, regression results, and release gates. |
| Financial model | Connects usage to cost, value, budget, forecast, and portfolio decisions. |
| Vendor and deployment model | Tracks providers, contracts, pricing, model versions, and exit options. |
AI value taxonomy
The framework must define value with the same precision it defines cost. A cost number tells a team what to cut. A value number tells a team what to scale. Without both, dashboards drive cuts instead of decisions.
| Value type | Examples | How to measure |
|---|---|---|
| Revenue growth | More qualified leads, better conversion, higher retention | Pipeline created, conversion lift, renewal rate, revenue per user |
| Cost reduction | Less manual review, fewer support contacts | Labor cost avoided, tickets deflected, operating cost reduced |
| Productivity | Faster drafting, search, analysis, coding, or review | Time-to-complete, throughput per person, cycle time |
| Quality improvement | Fewer errors, better consistency, less rework | Accuracy, rework rate, defect rate, review findings |
| Customer experience | Faster answers, better support, more self-service | CSAT, containment rate, response time, resolution time |
| Risk reduction | Better compliance checks, safer content handling | Incident rate, audit findings, policy violations, exposure avoided |
Important: Do not treat time saved as cash saved unless the business can show how that time converts to lower cost, higher output, faster revenue, or better service. Productivity savings that never show up in headcount, throughput, or revenue are a credibility problem waiting to happen.
AI cost taxonomy
Most programs undercount the full cost of AI because they stop at inference. A complete cost view must include retrieval, evaluation, operations, and human review. Leave these out and the business case will look better than reality.
| Cost category | Examples |
|---|---|
| Inference | Input tokens, output tokens, reasoning tokens, image/audio/video units |
| Embeddings | Document embedding, query embedding, refresh jobs |
| Retrieval | Vector database, search, reranking, document processing |
| Storage | Prompts, traces, outputs, embeddings, documents, metadata |
| Orchestration | Agents, workflow engines, queues, schedulers, tool calls |
| Human review | Approval, QA, exception handling, escalation |
| Evaluation | Test sets, judge models, labeling, regression runs |
| Platform | Gateway, observability, monitoring, support tooling |
| Security and compliance | Redaction, audit, retention, access review, legal review |
| Operations | Incident response, prompt updates, model changes, vendor management |
Business case model
Each material AI use case should have a business case before scaling. It does not need to be large, but it must be explicit. A use case without a business case is a bet without odds.
Net AI value = business benefit − AI run cost − build cost − operating cost − risk cost
| Field | Decision question |
|---|---|
| Business outcome | What will this use case improve? |
| Baseline | What is the current cost, speed, quality, or conversion rate? |
| Expected benefit | What value should the AI workflow create? |
| Cost per outcome | What will one successful outcome cost end to end? |
| Quality threshold | What quality level must the workflow meet? |
| Human review cost | What manual work remains? |
| Operating cost | What will it cost to support and improve the workload? |
| Risk cost | What risk, compliance, or legal cost must be included? |
| Payback period | When should value exceed total cost? |
| Decision | Scale, optimize, pause, retire, or rework. |
Metrics and reporting
Different audiences need different metrics. An engineering dashboard full of token counts will not move an executive conversation. A slide showing “AI spend as % of revenue” will not help an engineer find a cache miss. Build three views and serve the right one to the right room.
Executive KPIs
| KPI | Purpose |
|---|---|
| AI spend as % of value created | Shows whether AI is paying for itself. |
| Gross margin impact | Shows whether AI cost changes the unit economics of the product or service. |
| Cost per business outcome | Shows the real cost of each useful result. |
| Value per business outcome | Shows which work should scale. |
| Forecast accuracy | Builds trust with finance. |
Product KPIs
| KPI | Purpose |
|---|---|
| Cost per successful task | Links spend to user value. |
| Quality pass rate | Shows whether the workflow meets the bar. |
| Latency per outcome | Tracks user experience. |
| Human escalation rate | Shows how much work still needs people. |
| Adoption and retention | Shows whether the feature is useful. |
Engineering KPIs
| KPI | Purpose |
|---|---|
| Tokens per outcome | Finds prompt and context waste. |
| Cache hit rate | Measures reuse. |
| Model routing mix | Shows whether cheaper models handle the right work. |
| Retry and error rate | Finds hidden cost drivers. |
| Tool-call count per task | Controls agentic workflow cost. |
Forecasting model
AI forecasts should be driver-based. A flat monthly trend is not enough because usage, token intensity, model mix, and workflow depth can all change fast, often in different directions. Build the forecast from its actual inputs.
| Forecast driver | What to model |
|---|---|
| Usage volume | Users, requests, tasks, documents, tickets, or workflows. |
| Token or unit intensity | Prompt size, retrieved context, completion size, reasoning depth, media units. |
| Model mix | Small, medium, capable, reasoning, domain-specific, or self-hosted models. |
| Workflow depth | Number of calls, retries, tool calls, and agent turns per outcome. |
| Cache rate | Percent of work avoided through exact, semantic, or provider-side caching. |
| Error and retry rate | Failed calls that still consume budget. |
| Growth and seasonality | Launches, campaigns, peak periods, and adoption curves. |
| Pricing and contract changes | Provider price changes, discounts, commitments, or deprecations. |
Every material workload should have three forecast scenarios: base case, high-growth case, and runaway-cost case. The runaway-cost case is not pessimism. It is a safety check that shows where limits and alerts must exist before usage spikes.
Agentic workflow controls
Agents change the cost model fundamentally. One user request can fan out into many model calls, tool calls, searches, retries, and intermediate steps. The call-level view hides the real exposure. Manage agents at the task level. Budget and measure at the outcome, not the turn.
| Control | Purpose |
|---|---|
| Max turns per task | Prevents loops and uncontrolled reasoning chains. |
| Max tool calls per task | Limits expensive external actions. |
| Budget per task | Stops work when cost exceeds the value of the outcome. |
| Confidence threshold | Controls when the agent can act without escalation. |
| Human approval gates | Protects high-risk or high-cost actions. |
| Trace logging | Explains why a task cost what it cost. |
| Failure path handling | Prevents retry storms and repeated failed work. |
| Outcome-level evals | Tests whether the full workflow completed the task, not whether one answer looked good. |
Governance gates
Governance should be light enough to use and strong enough to prevent waste. Heavy gates get bypassed. No gates mean teams discover cost surprises after launch. The goal is a fast, credible path with clear decision points, not a committee.
| Gate | Core question |
|---|---|
| Intake | What business outcome will this create? Who owns it? |
| Architecture review | Is the model, retrieval, context, and deployment pattern cost-effective? |
| Data review | What data enters the workflow? What data leaves it? |
| Cost review | What is the expected cost per outcome and monthly run rate? |
| Evaluation review | What quality bar must the workflow pass? |
| Launch review | Are limits, alerts, logs, owners, and rollback paths in place? |
| Portfolio review | Should the workload scale, optimize, pause, retire, or rework? |
Operating model and RACI
Ownership turns data into action. A showback dashboard that nobody is accountable for changes nothing. Each AI workload needs named owners for value, cost, quality, risk, and operations. Those names should be attached to the bill.
| Role | Primary responsibility |
|---|---|
| Executive sponsor | Owns business priority and funding decisions. |
| Product owner | Owns the use case, adoption, value, and roadmap. |
| Engineering owner | Owns design, reliability, run cost, and technical controls. |
| AI platform owner | Owns common access layer, telemetry, routing, and shared tools. |
| Security owner | Owns access policy, data protection, and incident response. |
| Finance owner | Owns forecast, budget, showback, chargeback, and financial reporting. |
| Procurement owner | Owns provider strategy, contract terms, and commercial leverage. |
| Legal or compliance owner | Owns legal, regulatory, retention, and contractual risk. |
| Evaluation owner | Owns test sets, quality gates, regression tests, and release approval. |
Maturity model
Most programs do not fail. They stall. They instrument one workload, declare success, and never build the operating model that lets the discipline scale. The maturity model below is a diagnostic, not a roadmap. Use it to find where the constraint is, then fix that before adding more.
| Level | Description | Next move |
|---|---|---|
| Level 1: Ad hoc | Teams use AI with little central visibility. | Create a use case inventory and baseline spend. |
| Level 2: Visible | Key workloads have usage and cost telemetry. | Add outcome IDs, value tracking, and dashboards. |
| Level 3: Controlled | Policies, quotas, showback, and launch gates exist. | Expand controls across teams and improve forecasts. |
| Level 4: Optimized | Routing, caching, evals, and unit economics guide design. | Automate optimization and portfolio reviews. |
| Level 5: Value-managed | AI spend is managed as a value portfolio. | Scale high-value work and retire low-value work. |
The pitfalls
Nine mistakes account for most of the trouble I’m called in to fix. If VALUE is how the discipline works, these are how it breaks.
Treating AI like normal cloud, running it through the existing cloud cost tool with a few new tags bolted on. The cost drivers, the cadence of pricing change, and the business stakeholders are all different. The function needs its own runway.
Close behind: optimizing for capability instead of cost-per-outcome. Teams pick the most capable model because the demo was impressive, then never circle back once the workload stabilizes into something routine and high-volume. The right model is the cheapest one that passes your evaluation bar, and you only know that bar if you have evaluations.
Counting cost but not value is the pitfall that produces the wrong dashboard: one that shows spend without the value it bought, which will drive cuts instead of decisions. Pair the two numbers or you can’t tell what to scale and what to kill.
Less discussed but just as expensive: ignoring human review cost. A workflow looks cheap right up until the review, exception, and escalation work gets counted. The full cost of the outcome includes every person who touches it, not just the model call.
Agents running without budgets is the newest failure mode, and the one that scales fastest, a single ungoverned loop of retries and tool calls can turn one task into an uncontrolled cost event overnight. Set max turns, max tool calls, and a budget cap per task before agents reach production, not after the first incident.
Then there’s shadow AI: central IT moves slowly, a business unit swipes a credit card, and six months later you have eleven vendor relationships, no consolidated negotiation leverage, and customer data flowing through systems nobody reviewed. The remedy is a credible, fast central offering, not a memo banning the alternatives.
Token waste rarely looks like one bad decision, it’s verbose system prompts, sending the entire conversation history when a summary would do, forgetting to set max-tokens, no streaming-cancel on the client side. Individually small, and it compounds viciously at scale. A prompt-hygiene review almost always finds 15–25% savings in the first pass.
Vendor lock-in without an exit plan. Fine until pricing shifts, a model gets deprecated, or a regulatory wind changes direction. The cheapest insurance is an abstraction layer in your access layer and at least one evaluated alternative kept warm.
And the one that undoes all the rest: cutting cost without evals. Lower spend is not success if quality, trust, or conversion drops with it. Run regression tests before every cost optimization ships, not after someone notices.
Decision rules
When the right choice is not obvious, these rules of thumb resolve most decisions. They are not hard rules (edge cases exist) but they hold in most production situations.
| Decision | Rule of thumb |
|---|---|
| Use a smaller model | When it meets the quality bar for the task. |
| Use a larger or frontier model | When task value, complexity, or risk justifies the cost. |
| Use retrieval | When knowledge changes often or context must be grounded in current data. |
| Use fine-tuning | When the task is narrow, stable, high-volume, and evals prove the payback. |
| Use batch processing | When the user does not need a real-time answer. |
| Use caching | When requests repeat or are similar enough to reuse prior work. |
| Use human review | When the cost of an error is higher than the cost of review. |
| Use an agent | When the value of completing the full task exceeds the cost and risk of multiple steps. |
| Self-host a model | When sustained volume, control needs, and operating skills beat hosted alternatives. |
| Use a SaaS AI feature | When speed, support, and workflow fit beat custom build economics. |
Implementation artifacts
The framework becomes operational when teams use a shared set of artifacts. Without these, every team reinvents the same templates and the operating model stays informal.
| Artifact | Purpose |
|---|---|
| Use case intake form | Captures outcome, owner, data class, expected value, cost estimate, and risk. |
| AI cost taxonomy | Defines what costs must be included in the full cost view. |
| Value case template | Links baseline, benefit, cost, quality, and payback. |
| Tagging standard | Defines required usage and outcome metadata. |
| Showback dashboard | Shows cost, value, trends, and owners. |
| Forecast model | Projects cost with usage, token intensity, model mix, cache rate, and growth. |
| Evaluation scorecard | Defines quality gates and regression results. |
| Governance checklist | Confirms controls are in place before launch. |
| Portfolio review pack | Supports scale, optimize, pause, retire, or rework decisions. |
How to start: the first 90 days
Resist the temptation to start with the framework. Start with one workload, ideally one that’s already in production and already expensive. That anchor workload becomes the proof point that funds everything else. Strategy follows demonstrated value; the inverse rarely works in enterprise environments.
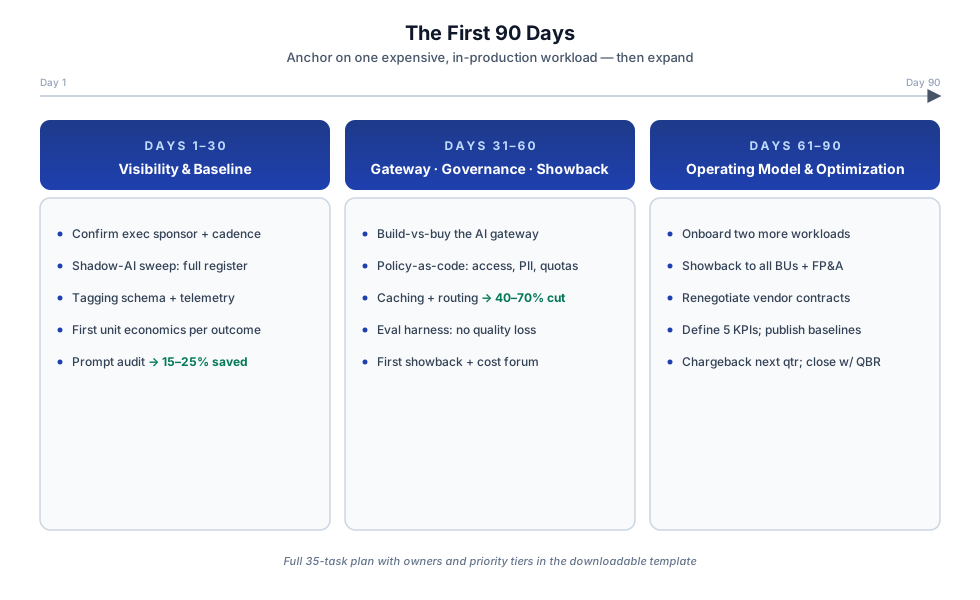
The first 90 days in three phases: make spend legible, stand up the access layer and showback, then make the operating model permanent and start optimizing.
Days 1–30: Visibility and baseline. Confirm an executive sponsor and get a steering cadence on the calendar. Programs without one stall in week six. Run a shadow-AI sweep: build a register of every AI use case, vendor, and data flow. Define your tagging schema and stand up basic telemetry on the anchor workload, then compute your first unit economics. Run a prompt-hygiene audit on your top three workloads. It almost always surfaces 15–25% of easily recoverable spend.
Days 31–60: Access layer, limits, and showback. Make the build-vs-buy decision on your AI access layer and move fast; it’s the chokepoint everything else depends on. Once it’s in front of the anchor workload, implement policy-as-code: access rules, PII redaction, output filtering, quota enforcement. On the architecture side, roll out semantic caching and pilot tiered routing. The combination typically delivers 40–70% cost reduction with no measurable quality loss when you run the evaluation harness in parallel to prove it. By month’s end, the first showback dashboard should be live and the first monthly cost forum held with BU leads.
Days 61–90: Operating model and optimization. Onboard two more workloads behind the access layer. Roll out showback to all participating BUs and establish the forecasting cadence with FP&A. If you’ve kept the vendor inventory current, this is the window to renegotiate. Consolidated leverage is worth real money at renewal. Define the five KPIs that carry through every QBR: cost per outcome, cache hit rate, model mix percentage, eval pass rate, and percentage of traffic routed through the access layer. Publish the baselines, set chargeback to take effect next quarter, and close with a QBR where AI spend sits alongside revenue and gross margin.
The full 35-task version of this plan with deliverables, suggested owners, and priority tiers is available as a downloadable template.
Starting maturity and 90-day goals
Where the 90 days land depends on where the organization starts. Use this as a calibration, not a ceiling.
| Starting maturity | Realistic 90-day goal |
|---|---|
| Early (Level 1–2) | Inventory use cases, instrument one workload, define tagging, create first dashboard. |
| Scaling (Level 3) | Add common access layer, showback, caching, routing, and eval harness. |
| Mature (Level 4+) | Adopt chargeback, automated policy, vendor optimization, and portfolio governance. |
When it applies
VALUE is built for enterprises running multiple AI use cases across more than one team, where spend is material enough that the CFO has noticed, or soon will. If you have a single workload and one team, you don’t need the full operating model yet: start with V and E, and add the rest as you scale. The framework earns its overhead precisely when decentralized adoption, fast-moving pricing, and cross-provider vendor relationships start to compound.